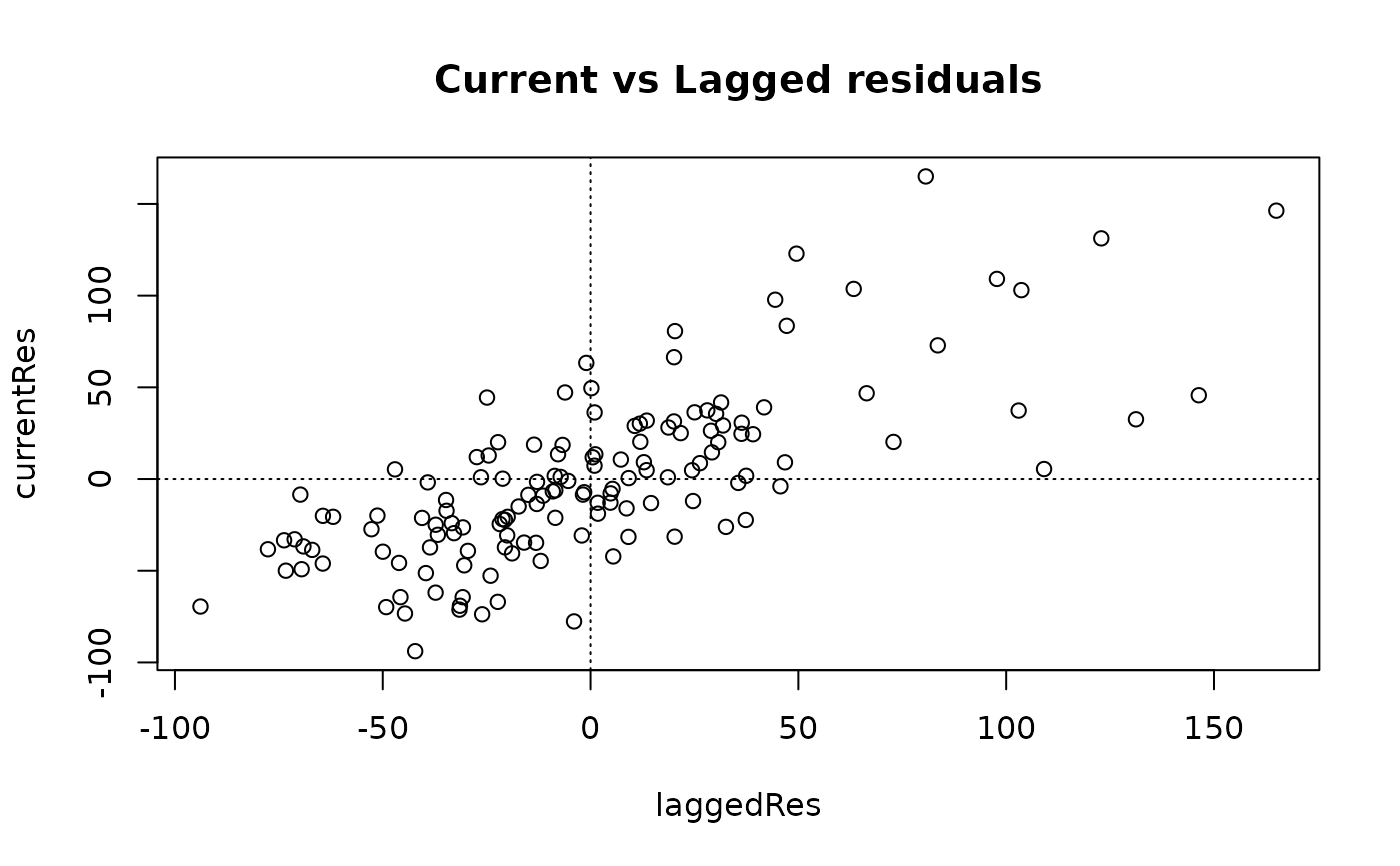
Plots current vs lagged residuals along with quadrants dividing these residuals about the value zero.
Value
Plots current vs lagged residuals along with quadrants dividing these residuals about the value zero.
Plots current vs lagged residuals along with quadrants dividing these residuals about the value zero.
Plots current vs lagged residuals along with quadrants dividing these residuals about the value zero.