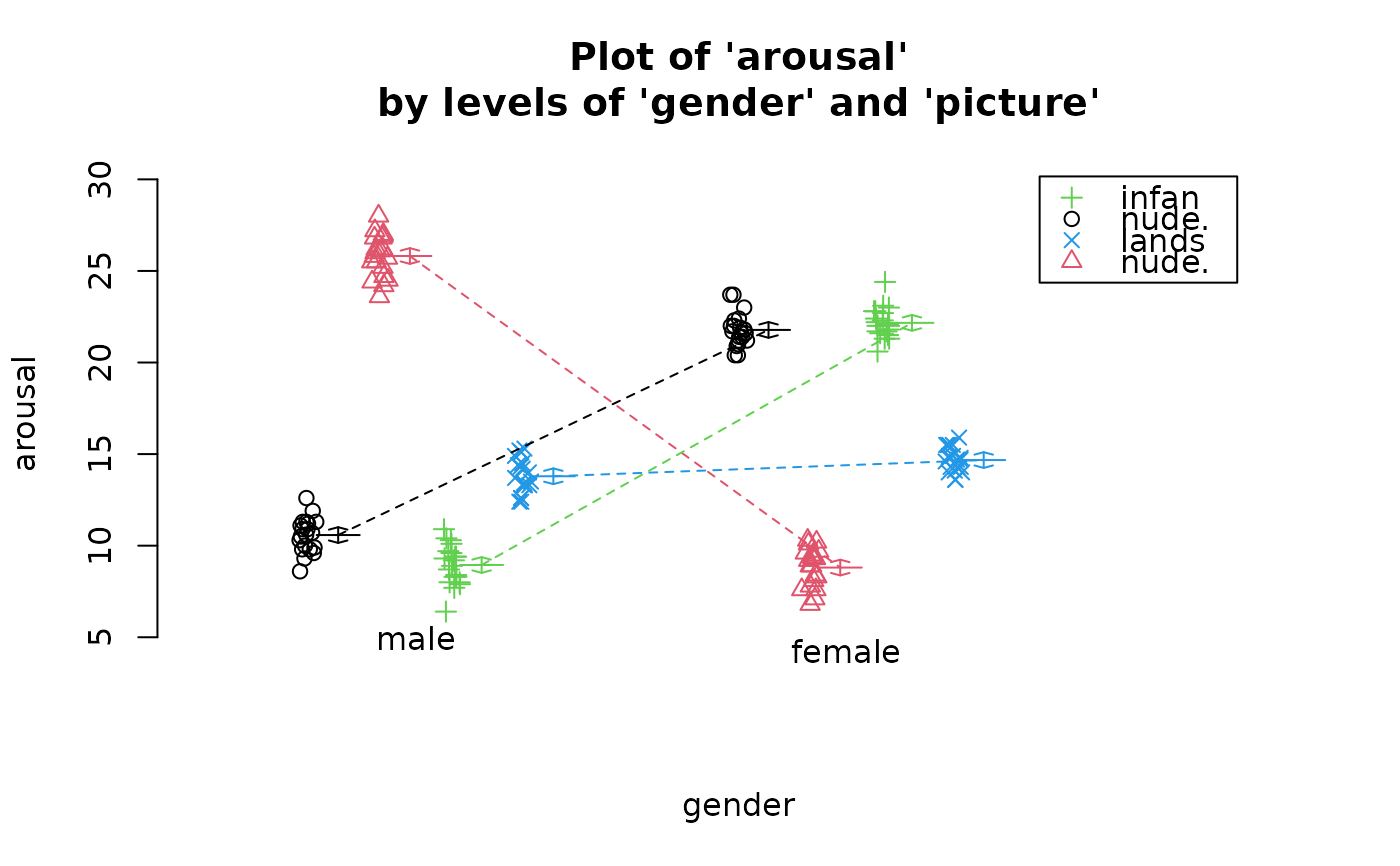
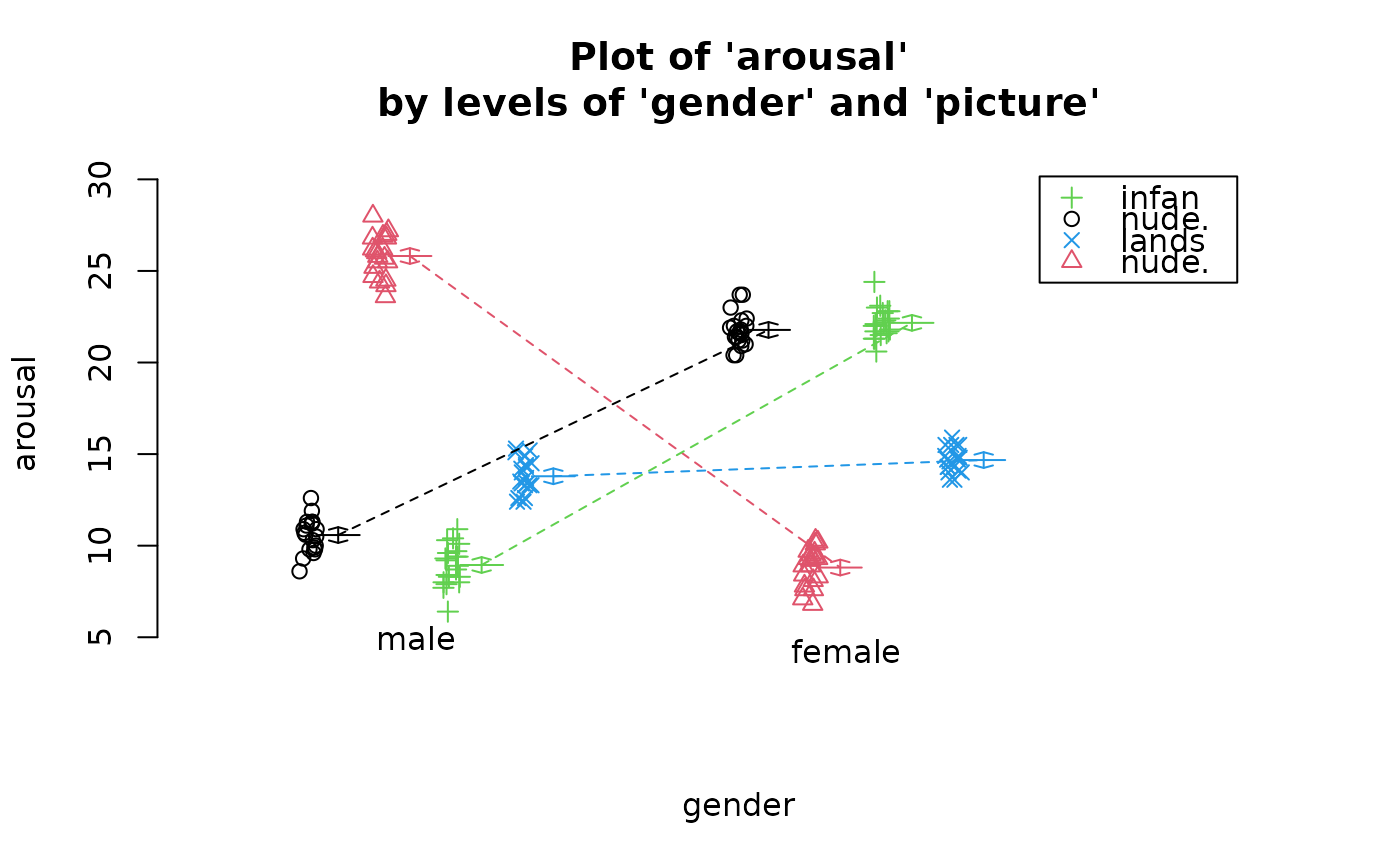
Displays data with intervals for each combination of the two factors and shows the mean differences between levels of the first factor for each level of the second factor. Note that there should be more than one observation for each combination of factors.
Usage
interactionPlots(y, ...)

# Default S3 method
interactionPlots(
  y,
  fac1 = NULL,
  fac2 = NULL,
  xlab = NULL,
  xlab2 = NULL,
  ylab = NULL,
  data.order = TRUE,
  exlim = 0.1,
  jitter = 0.02,
  conf.level = 0.95,
  interval.type = c("tukey", "hsd", "lsd", "ci"),
  pooled = TRUE,
  tick.length = 0.1,
  interval.distance = 0.2,
  col.width = 2/3,
  xlab.distance = 0.1,
  xlen = 1.5,
  ylen = 1,
  ...
)

# S3 method for class 'formula'
interactionPlots(
  y,
  data = NULL,
  xlab = NULL,
  xlab2 = NULL,
  ylab = NULL,
  data.order = TRUE,
  exlim = 0.1,
  jitter = 0.02,
  conf.level = 0.95,
  interval.type = c("tukey", "hsd", "lsd", "ci"),
  pooled = TRUE,
  tick.length = 0.1,
  interval.distance = 0.2,
  col.width = 2/3,
  xlab.distance = 0.1,
  xlen = 1.5,
  ylen = 1,
  ...
)
Arguments
- y
either a formula of the form: y~fac1+fac2 where y is the response and fac1 and fac2 are the two explanatory variables used as factors, or a single response vector
- ...
optional arguments.
- fac1
if 'y' is a vector, then fac1 contains the levels of factor 1 which correspond to the y value
- fac2
if 'y' is a vector, then fac2 contains the levels of factor 2 which correspond to the y value
- xlab
an optional label for the x-axis. If not specified the name of fac1 will be used.
- xlab2
an optional label for the lines. If not specified the name of fac2 will be used.
- ylab
An optional label for the y-axis. If not specified the name of y will be used.
- data.order
if TRUE the levels of fac1 and fac2 will be set to unique(fac1) and unique(fac2) respectively.
- exlim
provide extra limits.
- jitter
the amount of horizontal jitter to show in the plot. The actual jitter is determined as the function is called, and will likely be different each time the function is used.
- conf.level
confidence level of the intervals.
- interval.type
four options for intervals appearing on plot: 'tukey', 'hsd', 'lsd' or 'ci'.
- pooled
two options: pooled or unpooled standard deviation used for plotted intervals.
- tick.length
size of tick, in inches.
- interval.distance
distance, as a fraction of the column width, between the points and interval. This is in addition to the extra space allocated for the jitter.
- col.width
width of a factor `column', as a fraction of the space between the centres of two columns.
- xlab.distance
distance of x-axis labels from bottom of plot, as a fraction of the overall height of the plot.
- xlen, ylen
character interspacing factor for horizontal (x) and vertical (y) spacing of the legend.
- data
an optional data frame containing the variables in the model.
Methods (by class)
interactionPlots(default): Interactions Plot for Two-way Analysis of VarianceinteractionPlots(formula): Interactions Plot for Two-way Analysis of Variance