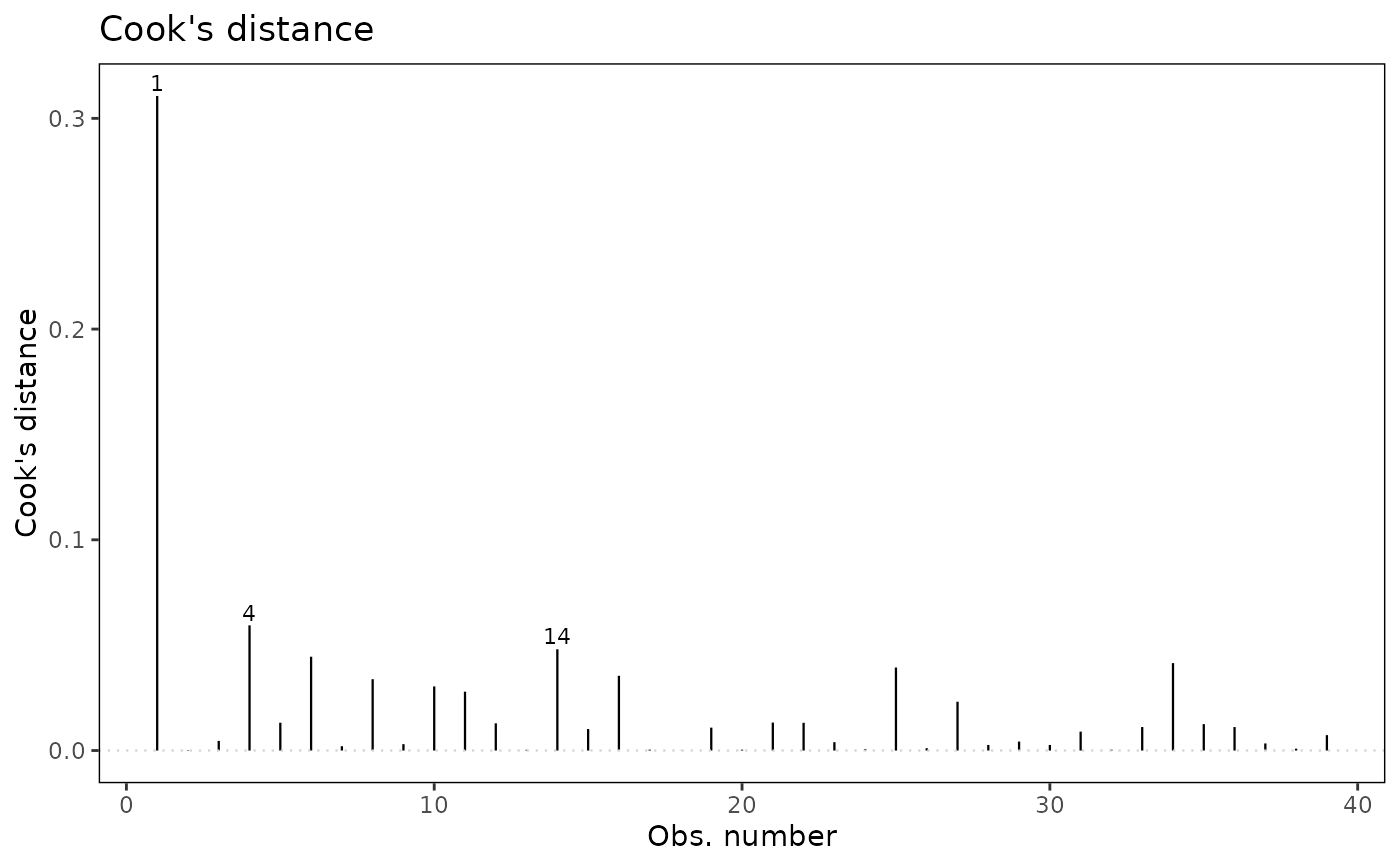
Draw the teaching diagnostic plots used by older `s20x` workflows. `modelcheck()` is retained as an exported compatibility helper for model checking, while newer teaching material may use focused diagnostic helpers such as [eovcheck()], [normcheck()], and [cooks20x()] directly.
Arguments
- x
The fitted model.
- which
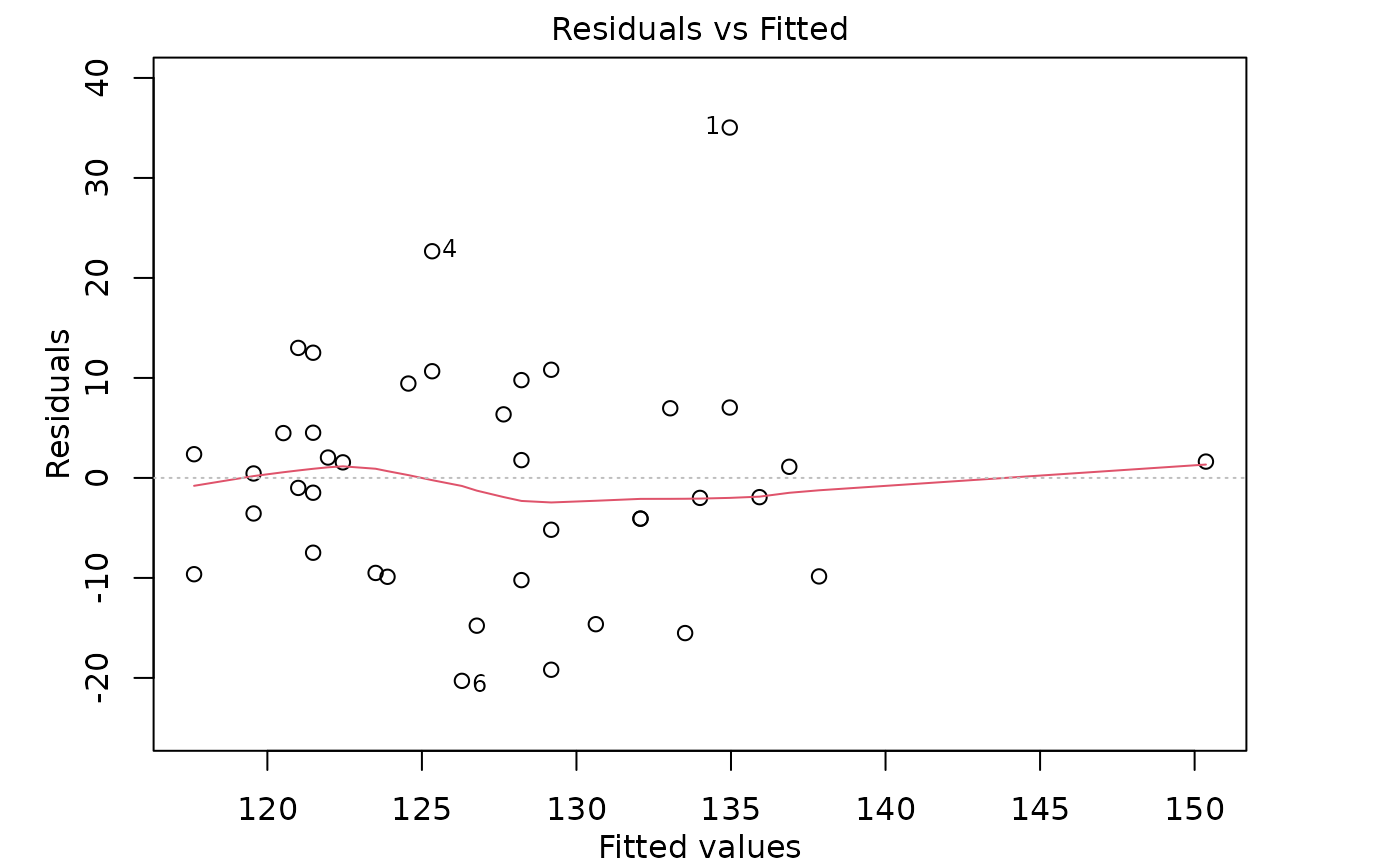
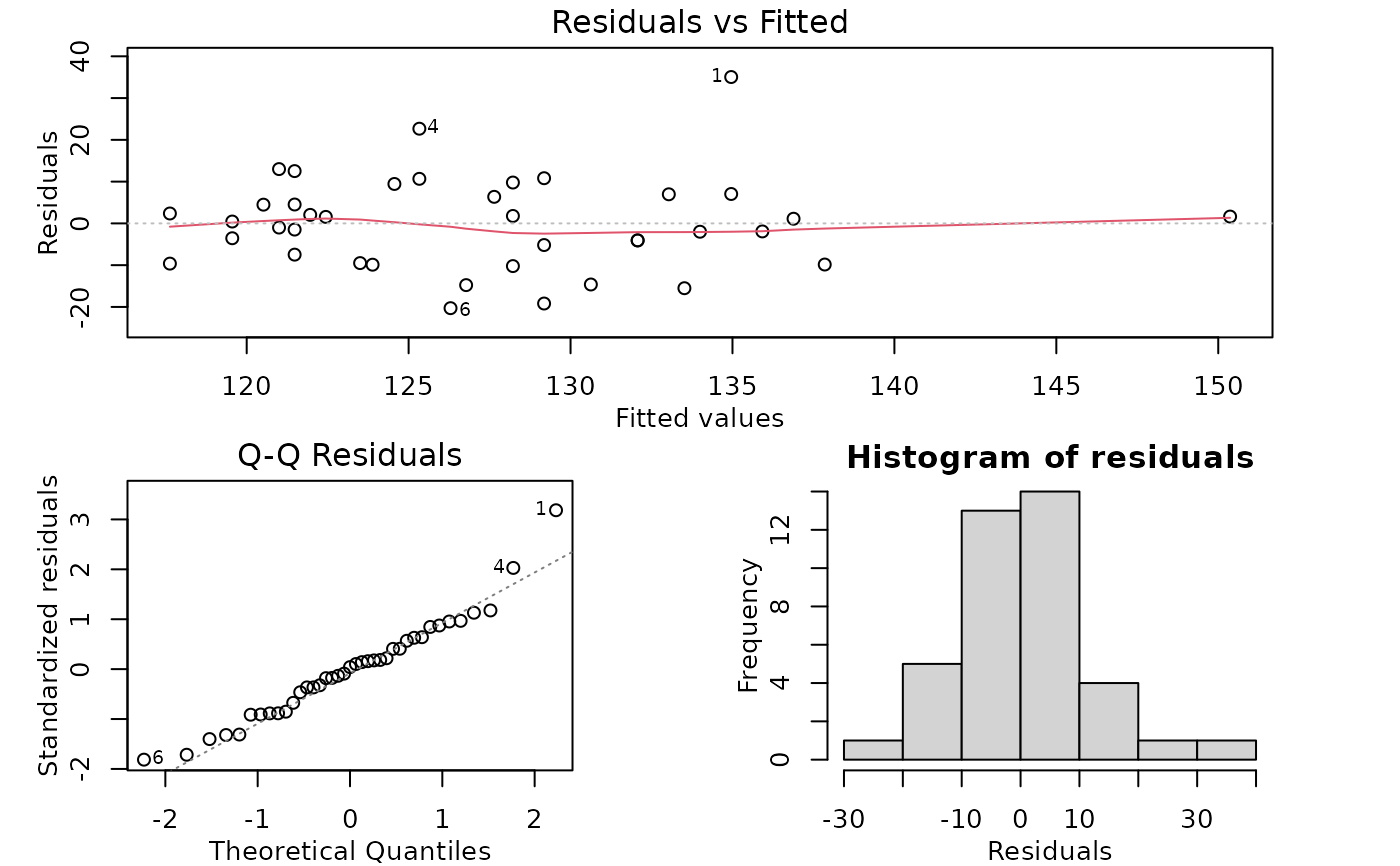
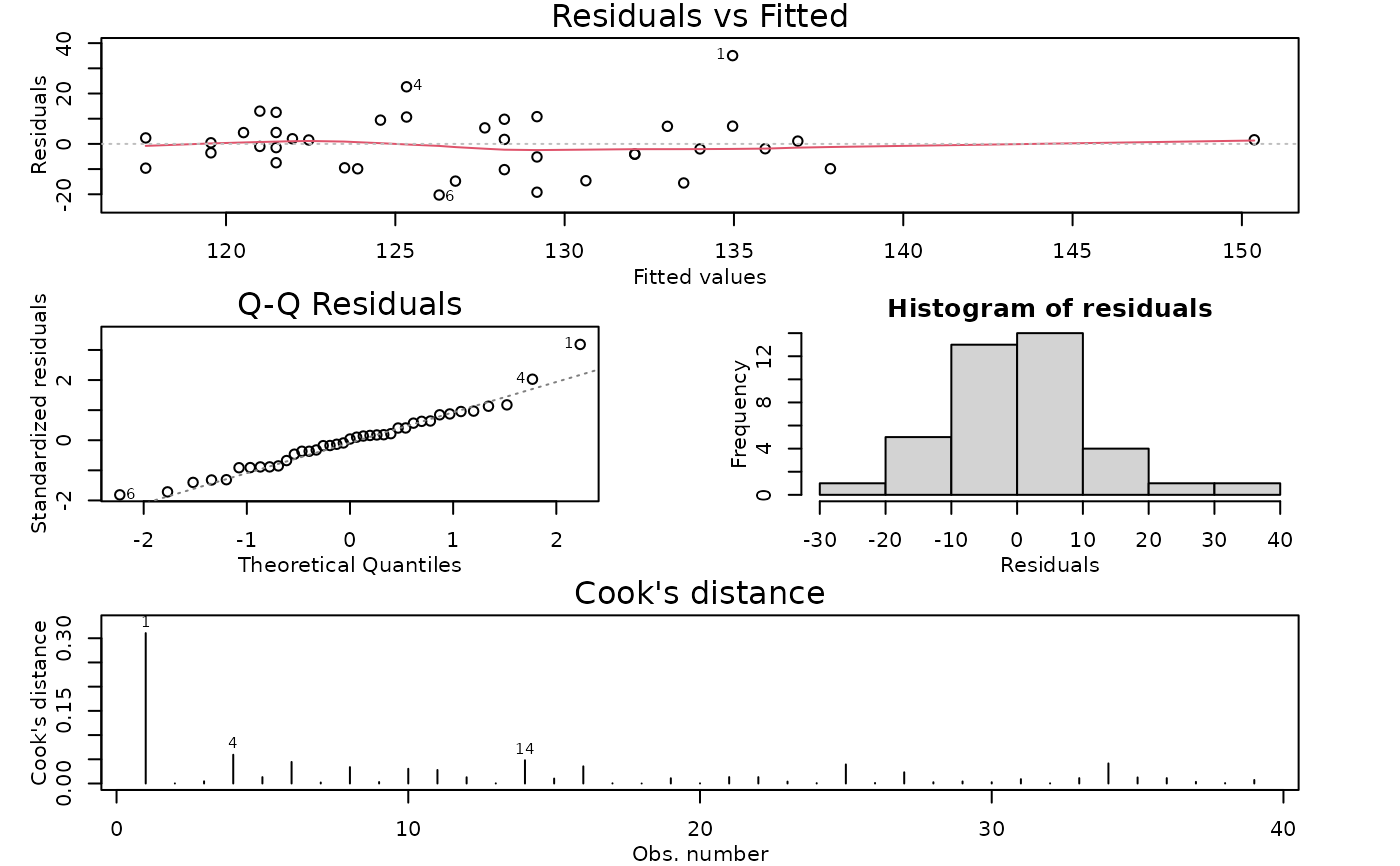
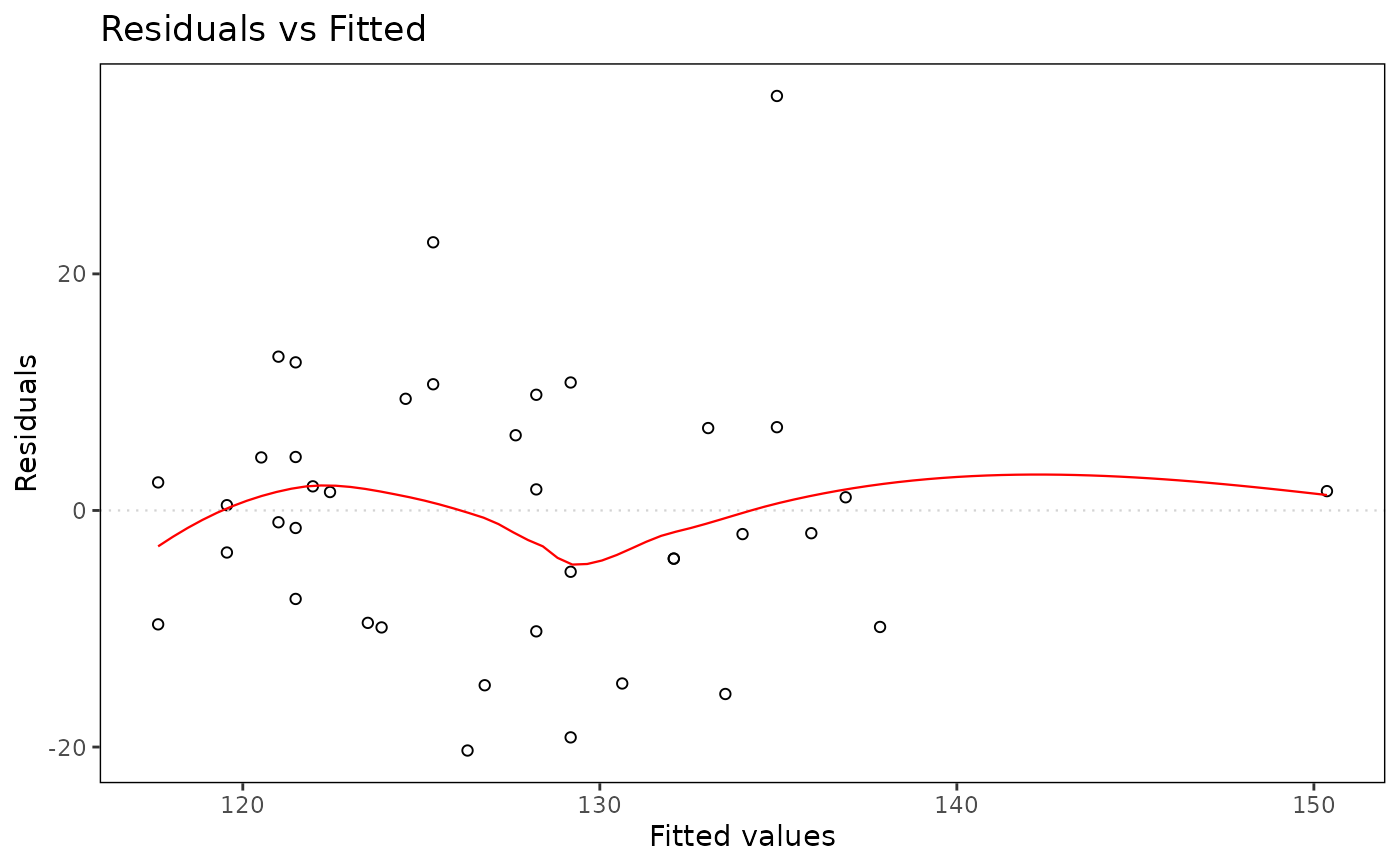
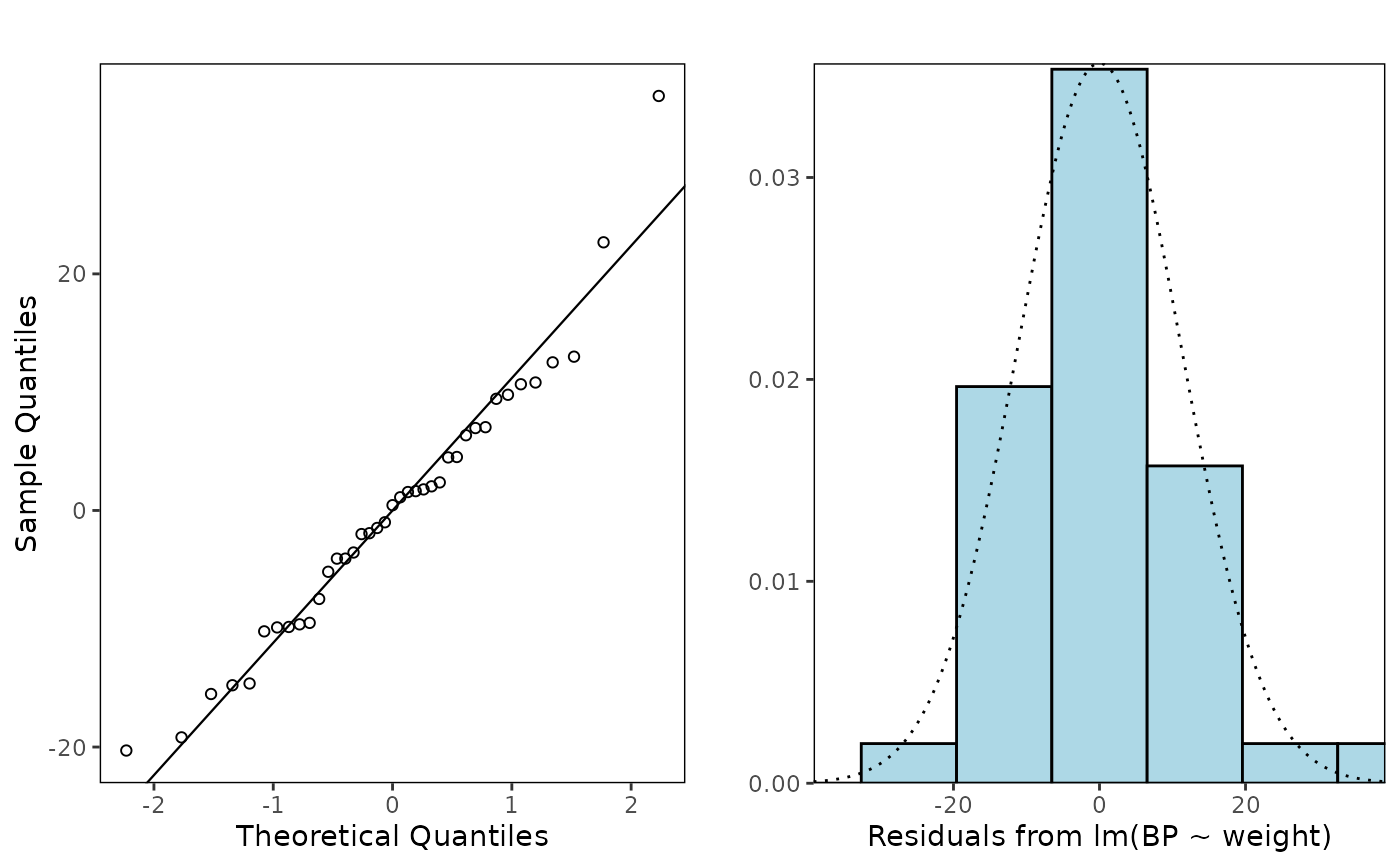
The plot(s) to be drawn. Residuals versus fitted values (
which = 1), histogram and Q-Q plot of residuals (which = 2), and Cook's distance plot (which = 3).- mar
Margins applied to each selected plot. Ignored by the ggplot2 engine.
- engine
plotting engine to use. The default,
"base", preserves the original base graphics output. Use"ggplot2"for ggplot2 objects.- ...
any other arguments to pass to
plotfor the base engine. Extra arguments are currently ignored by the ggplot2 engine.
Value
Draws diagnostic plots for teaching model checking when using the
base engine. With engine = "ggplot2", returns a ggplot object for a
single selected plot, or a named list of ggplot objects for multiple selected
plots.
Details
The default base graphics engine preserves the original teaching plots and draws directly on the active graphics device. The ggplot2 engine is intended for users who want reusable plot objects for reports or further customisation, and returns ggplot objects instead of drawing base graphics side effects.
Examples
data(peru.df)
lmFit = lm(BP ~ weight, data = peru.df)
# Plot residuals versus fitted values only
modelcheck(lmFit, 1)
 # Plot residuals versus fitted values, histogram, and Q-Q plot
modelcheck(lmFit, 1:2)
 # Plot all diagnostics
modelcheck(lmFit)
 # ggplot2 engine for reusable plot objects
diagnosticPlots = modelcheck(lmFit, engine = "ggplot2")
names(diagnosticPlots)
#> [1] "residuals" "qq" "histogram" "cooks"
modelcheck(lmFit, which = 1, engine = "ggplot2")
 modelcheck(lmFit, which = 2, engine = "ggplot2")
 modelcheck(lmFit, which = 3, engine = "ggplot2")