
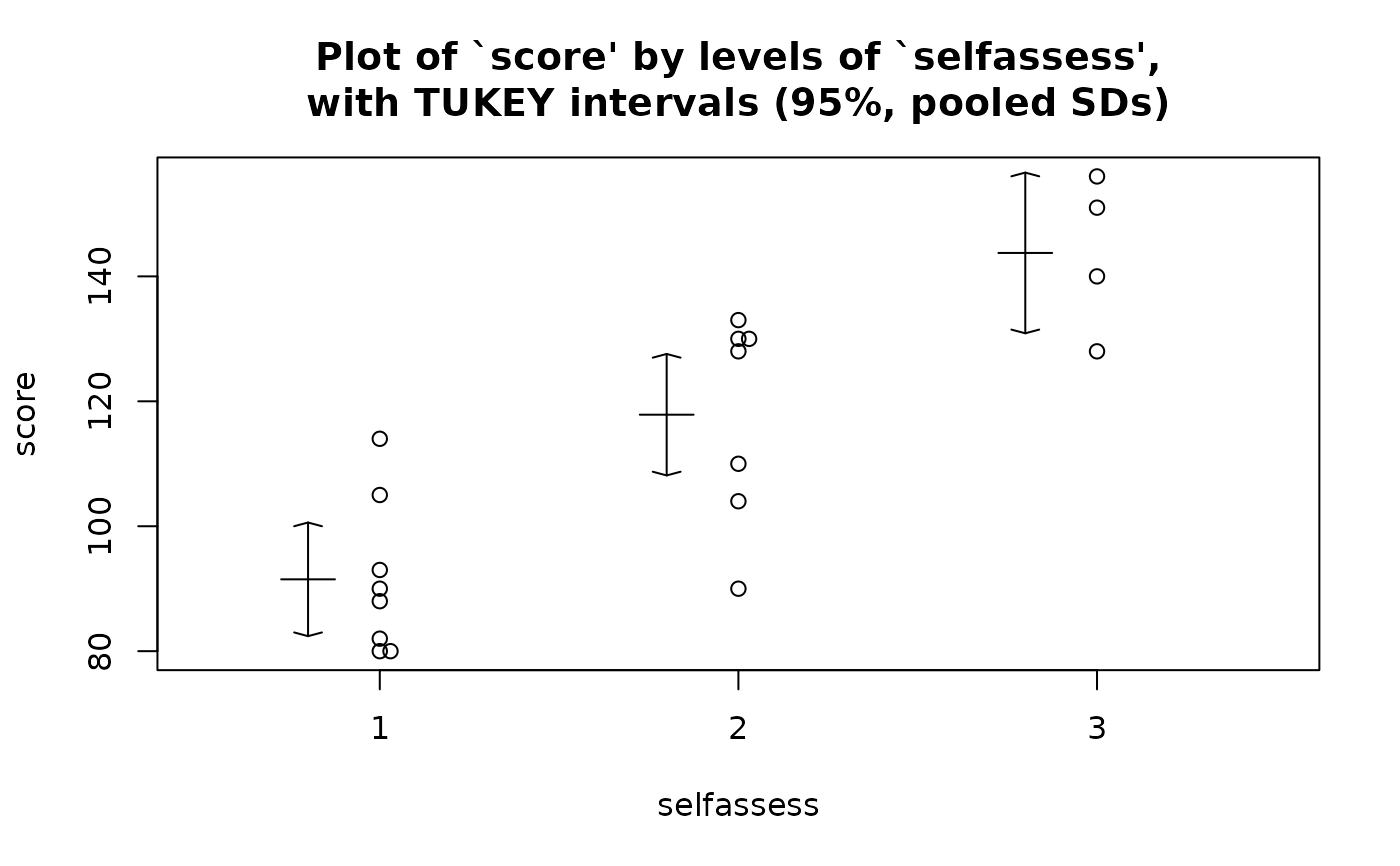
Displays summary information for a one-way anova analysis. The lm object must come from a numerical response variable and a single factor. The output includes: (i) anova table; (ii) numeric summary; (iii) table of effects; (iv) plot of data with intervals.
Usage
summary1way(
  fit,
  digits = 5,
  conf.level = 0.95,
  inttype = "tukey",
  pooled = TRUE,
  print.out = TRUE,
  draw.plot = TRUE,
  ...
)
Arguments
- fit
an lm object, i.e. the output from
lm.- digits
decimal numbers after the point.
- conf.level
confidence level of the intervals.
- inttype
three options for intervals appeared on plot: 'hsd','lsd' or 'ci'.
- pooled
two options: pooled or unpooled standard deviation used for plotted intervals.
- print.out
if
TRUE, print out the output on the screen.- draw.plot
if
TRUE, plot data with intervals.- ...
more options.
Value
Invisibly returns a list containing the one-way ANOVA summary components used in the printed teaching output. The list contains:
- Df
degrees of freedom for between groups, within groups, and total.
- Sum of Sq
sum of squares for between groups, within groups, and total.
- Mean Sq
mean squares for between groups and within groups.
- F value
the one-way ANOVA F statistic.
- Pr(F)
the P-value associated with the F test.
- Main Effect
the grand mean of the response.
- Group Effects
group deviations from the grand mean.
The printed ANOVA table, numeric summary, effects table, and optional plot are the primary teaching interface. The returned list is invisible so classroom use can focus on the printed output while programmatic callers can still inspect the computed values.
Examples
## Computer questionnaire data:
data(computer.df)
computer.df = within(computer.df, {
selfassess = factor(selfassess)
})
computer.fit = lm(score ~ selfassess, data = computer.df)
result = summary1way(computer.fit)
#> ANOVA Table:
#> Df Sum Squares Mean Square F-statistic p-value
#> Between Groups 2 7633.55075 3816.77538 19.1942 6e-05
#> Within Groups 16 3181.60714 198.85045
#> Total 18 10815.15789
#>
#> Numeric Summary:
#> Sample size Mean Median Std Dev Midspread
#> All Data 19 112.2105 110.0 24.51208 40.00
#> 1 8 91.5000 89.0 12.30563 14.50
#> 2 7 117.8571 128.0 16.61755 23.00
#> 3 4 143.7500 145.5 12.44655 15.25
#>
#> Table of Effects: (GrandMean and deviations from GM)
#> typ.val 1 2 3
#> 112.21053 -20.71053 5.64662 31.53947
 result
#> ANOVA Table:
#> Df Sum Squares Mean Square F-statistic p-value
#> Between Groups 2 7633.55075 3816.77538 19.1942 6e-05
#> Within Groups 16 3181.60714 198.85045
#> Total 18 10815.15789
#>
#> Numeric Summary:
#> Sample size Mean Median Std Dev Midspread
#> All Data 19 112.2105 110.0 24.51208 40.00
#> 1 8 91.5000 89.0 12.30563 14.50
#> 2 7 117.8571 128.0 16.61755 23.00
#> 3 4 143.7500 145.5 12.44655 15.25
#>
#> Table of Effects: (GrandMean and deviations from GM)
#> typ.val 1 2 3
#> 112.21053 -20.71053 5.64662 31.53947