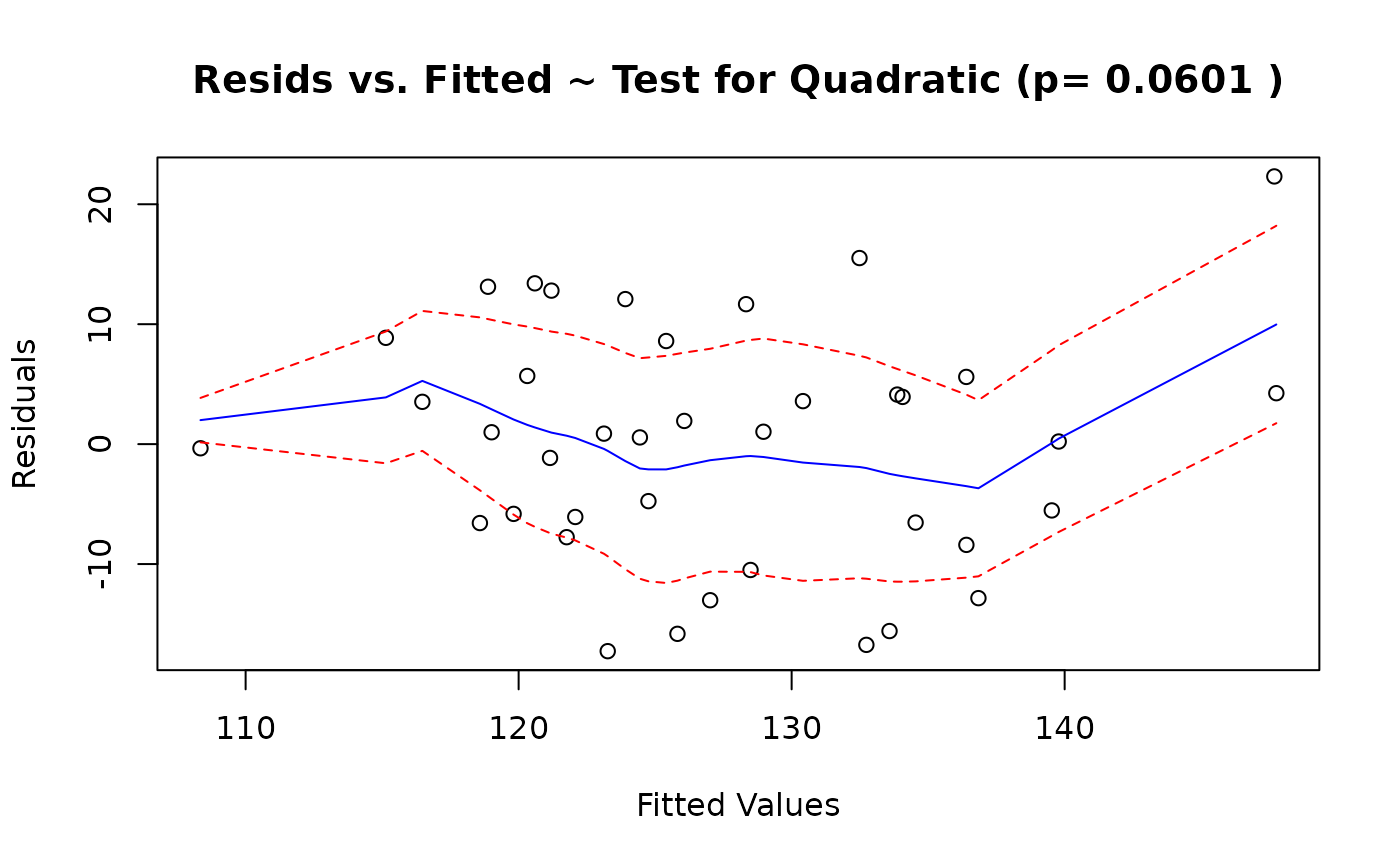
Plots a scatter plot for the variables of the residuals and fitted values from the linear model, lmfit. A lowess smooth line for the underlying trend, as well as one standard deviation error bounds for the scatter about this trend, are added to this scatter plot. A test for a quadratic relationship between the residuals and the fitted values is also computed.
Note
This is a legacy diagnostic plotting helper retained for compatibility
with older teaching material. New code should usually prefer the current
diagnostic workflow used by modelcheck().
Deprecated in s20x 3.4.0. Use modelcheck() instead.